The 2026–27 El Niño is still strengthening and has roughly a 60% chance of becoming the strongest on record since 1950, according to the US National Oceanic and Atmospheric Administration (NOAA). In its monthly ENSO update on Thursday, 12 November, NOAA’s Climate Prediction Center (CPC) kept its El Niño Advisory in place. It said a strong-to-very strong El Niño is likely to last through January–March 2027, with a greater than 79% chance. The odds of a “historic” event — a three-month index value of +2.5°C or more, beyond any El Niño since 1950 — sit at about 60% for October–December and November–January.
The event is not a forecast any more; it is already breaking records. Surface waters in the eastern equatorial Pacific are running more than 4°C above normal over a widening area, and the World Meteorological Organization (WMO) expects the event to peak around December.
Where the event stands now
In one month the central Niño-3.4 index rose from +2.1°C to +2.5°C, and anomalies above +4°C spread farther west across the eastern equatorial Pacific.
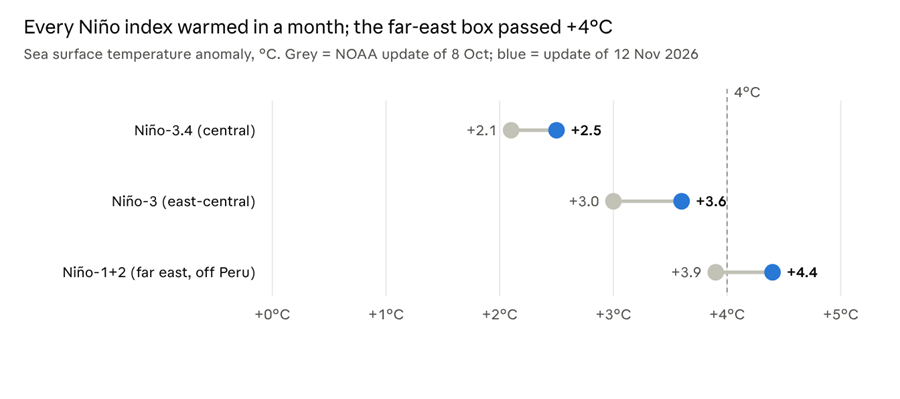
NOAA CPC ENSO Diagnostic Discussions, 8 October and 12 November 2026 · weekly Niño index values
The official three-month index lags the weekly numbers. NOAA’s RONI for August–October came in at +2.0°C, the second-highest value for that time of year since 1950 and just 0.1°C behind 1997. The atmosphere is fully coupled to the ocean: westerly wind anomalies run across the Pacific, rainfall has shifted east from Indonesia, and the Southern Oscillation Index is strongly negative.
How it stacks up against past giants
If the WMO’s forecast holds, the October–December average would be about +3.7°C, roughly a full degree above the 2015–16 record of +2.6°C.
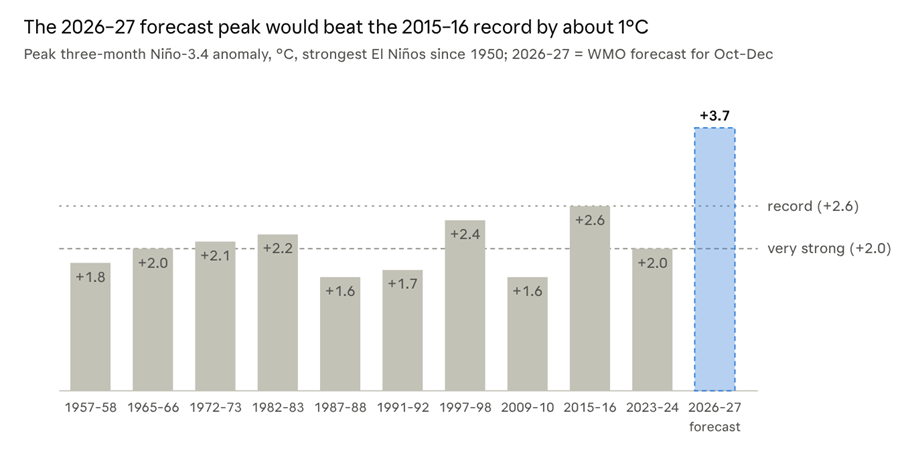
Past peaks: NOAA CPC Oceanic Niño Index (traditional ONI). 2026–27: WMO Global Seasonal Climate Update, 8 Oct 2026 (1993–2009 baseline), so the comparison is approximate
Only three events since 1950 are widely called “super” El Niños: 1982–83, 1997–98 and 2015–16. The current event has already broken daily records: on 18 September the daily Niño-3.4 anomaly reached +3.11°C, passing the satellite-era record set in November 2015, according to Carbon Brief. Some scientists compare its potential scale with the 1876–78 El Niño, which coincided with famines that killed millions.
How the odds of a record have moved
NOAA’s confidence in a record-breaking season peaked at 83% in October and eased to about 60% in November — still better than even odds.
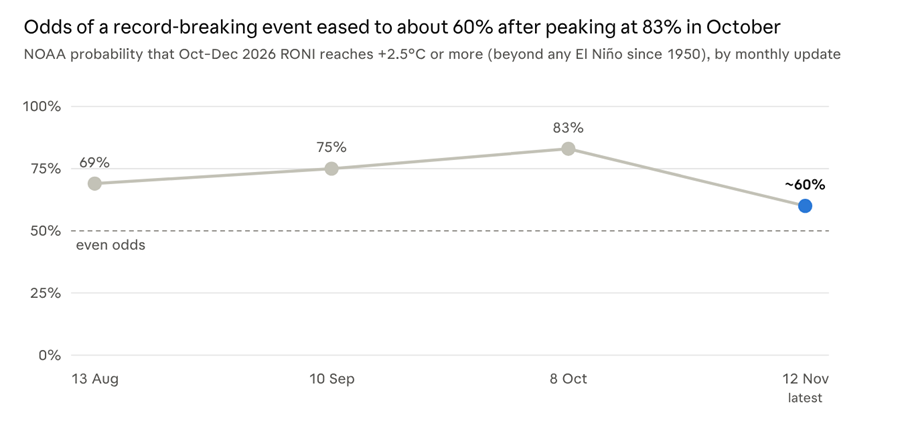
NOAA CPC ENSO Diagnostic Discussions, Aug–Nov 2026, as reported by Newsweek, Mountain Marker and CPC; Nov value given as “around 60%”
The dip reflects how close the three-month average sits to the +2.5°C bar, not a weakening event: every index warmed last month. When NOAA declared El Niño on 11 June, it gave a 63% chance of merely a “very strong” event (+2.0°C); that is now treated as near-certain. The WMO, which uses a different baseline, forecasts the most extreme sea surface temperatures ever observed in the region for October–December, peaking around December.
What El Niño is, and how its strength is measured
El Niño is the warm phase of the El Niño–Southern Oscillation (ENSO), a natural cycle of the tropical Pacific. Its other phases are ENSO-neutral and La Niña, which brings cooler-than-average water. Events typically come every two to seven years and last nine to twelve months.
During El Niño the trade winds weaken or reverse, and warm water that normally piles up near Indonesia spreads east. Rainfall follows the warm water, which reshapes weather worldwide: droughts in some regions, floods in others, more heat and more wildfire risk. El Niño adds no new heat to the planet; it releases heat the ocean had stored below the surface, which is why strong events tend to set global temperature records.
NOAA now uses the Relative Oceanic Niño Index (RONI) as its main yardstick. It takes the sea surface temperature anomaly in the Niño-3.4 box (5°N–5°S, 170°W–120°W) and subtracts the average anomaly across the whole tropics. That removes the background warming of all oceans, so today’s events can be compared fairly with those of the 1950s.
| Strength | Three-month RONI |
| Weak | +0.5°C to +1.0°C |
| Moderate | +1.0°C to +1.5°C |
| Strong | +1.5°C to +2.0°C |
| Very strong | +2.0°C and above |
| “Historic” (NOAA, this event) | +2.5°C and above |
“Super El Niño” is a media term; neither NOAA nor WMO uses it officially.
Impacts already felt
India’s 2026 monsoon ended 12.6% short of normal, the weakest season since 2015 and the country’s first monsoon drought in nine years.
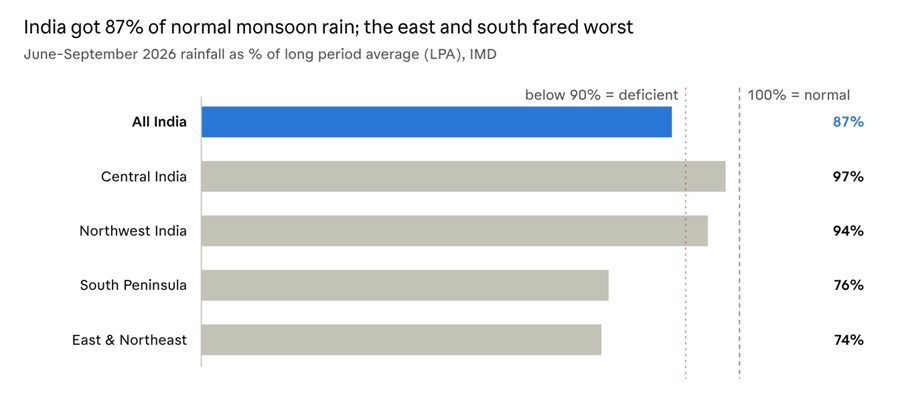
IMD, Salient Features of the 2026 Southwest Monsoon Season, 30 Sep 2026 · 1971–2020 LPA
The shortfall came in bursts: June brought 65% of normal rain and August 84%, with a long break in between, before a 92% September. East and Northeast India had their driest monsoon since records began in 1901. Elsewhere, the event helped hold the Atlantic to a single hurricane by early November, the fewest since 1925, while drought hit crops and livestock in Central America.
What comes next
NOAA expects El Niño to keep strengthening for a few more weeks and then begin to weaken in early 2027. The WMO puts the chance it persists through February 2027 at close to 100%, with a seasonal peak near +3.7°C on the traditional Niño-3.4 index around December.
The largest global temperature effect usually lags the ocean peak by several months. That puts 2027 at serious risk of replacing 2024 as the warmest year on record.
A strong El Niño raises the odds of these impacts but does not guarantee them; NOAA stresses that regional outcomes vary from event to event.
Fact-check notes
Two details in the original copy were adjusted against NOAA’s own text:
- Where the 4°C anomalies are. NOAA’s October and November discussions place the +4°C sea surface anomalies in the eastern equatorial Pacific, not the western Pacific. The western Pacific usually cools during El Niño.
- What RONI measures. RONI is not the raw Niño-3.4 anomaly; it is that anomaly minus the tropical-mean anomaly, which strips out background ocean warming.